🚀 Get to pre-production in weeks, not months, with private training direct from Jube’s developer — real sovereignty, zero vendor lock-in.
Performance Counter Balances
The nature of the Jube Platform is that immeasurable harm can be caused by the misconfiguration of a rule. Consider a scenario where all bank transactions are declined or all bidding is taking place on all impression opportunities as a consequence of a bad Activation Rule. Furthermore, the nature of real-time, ultra-high throughput systems, is that it is not especially feasible to measure performance on a transaction by transaction basis, instead relying on near time aggregate counters and statistics to measure the performance of the platform.
Counters keep a track of events that take place in Jube. There are two types of counter, which are known as Rolling counters and Reset counters:
- Rolling Counters when being incremented keep a record of the date and time of each component causing the counter to be incremented, which allow for the counter to be decremented at the point in time each counter entry expires. The Rolling Counter will never be reset to zero, rather it will maintain a balance of counter entries moving in, then moving out of the counter.
- Reset Counter are reset to zero every minute.
Rolling Counters include:
- Each time a Response Elevation is returned, greater than zero, a counter in incremented.
- Each time a Response Elevation is returned, greater than zero, a counter is increased by the value of the Response Elevation. Rather than a counter, it is a sum or balance.
- Each time a message is sent to the Activation Watcher, a counter is incremented.
Reset Counters include:
- Each time a transaction is processed through a model, a counter is incremented.
- Each time a Gateway Rule is matched upon, a counter is incremented.
- Each time a request is received on the Web Server \ HTTP Endpoint, a counter is incremented.
- Each time the HTTP Endpoint is switched to invoke an Entity Model, a counter is incremented.
- Each time the HTTP Endpoint is switched to invoke Entity Model Tagging, a counter is incremented.
- Each time the HTTP Endpoint is switched to recall an Exhaustive Adaptation directly, a counter is incremented.
- Each time the HTTP Endpoint is switched and has encountered an Error, a counter is incremented.
- Each time the HTTP Endpoint is switched to invoke an Entity Model asynchronously, a counter is incremented.
The HTTP counters can be inspected by navigating to Administration » Performance » HTTP Processing Counters.
It can be observed throughout this documentation that in memory asynchronous queues features heavily in the platforms architecture.
This counters routine is also responsible for recording the asynchronous queue balances on a snapshot basis.
For each model the following asynchronous queue balances are maintained:
- The number of payload records pending initial processing by the bulk insert routine and case creation routine.
- The number of case records pending processing.
- The number of Activation Watcher entries pending dispatch and storage.
The model asynchronous queue balances can be inspected by navigating to Administration » Performance » Model Asynchronous Queue Balances.
For the platform the following asynchronous queue balances are maintained in the overall execution:
- The number of Tags currently pending in the in memory asynchronous queue.
- The number of Real Time Model Invocation Entity objects pending invocation in the in memory asynchronous queue.
The asynchronous queue balances can be inspected by navigating to Administration » Performance » Queue Asynchronous Balances.
Observability Tables
Performance counter balances are written to PostgreSQL tables every 60 seconds. These tables are available for monitoring and alerting purposes.
In addition, several observability tables provide visibility into critical software areas where reliability is paramount. These areas include:
- Least Recently Used (LRU) cache
- Redis payload eviction
- Redis payload latest eviction
- Redis TTL counter eviction
- Real-time performance counters
- Local concurrent queue balances (used for asynchronous operations such as writes)
- Per-stage and per-task breakdowns of the invoke pipeline itself (Model Stage, Response Time Pipeline and Task Performance Counters), and of the two background pipelines that run off that thread entirely (Archiver and Case Creation)
- Warn-threshold breaches for those same three pipelines (Model Invoke, Archiver and Case Creation Warning), and the health of the bounded in-memory queues that capture them
- Redis call and OTLP export dispatch counters, and Postgres’s own per-query-shape aggregate statistics
| Table | Description |
|---|---|
| CacheTtlCounterEntryRemovalBatch | Records reference date expiration events for processing expired Time-to-Live (TTL) counters. Includes system reference date, overall expired counts, first and most recent reference dates. A record exists only if expired records are present. |
| CacheTtlCounterEntryRemovalBatchEntry | Contains TTL counter entries that have been updated or purged, including the system reference date, deprecated value, and revised counter value. |
| CacheTtlCounterEntryRemovalBatchResponseTime | Details task performance and response times for TTL counter maintenance. |
| CachePayloadLatestRemovalBatch | Tracks expiration of Payload Latest data for a given search key, including system reference date, total expired records, and first and most recent reference dates. |
| CachePayloadLatestRemovalBatchEntry | Contains details of payload latest values removed in a batch. |
| CachePayloadLatestRemovalBatchResponseTime | Details task performance and response times for CachePayloadLatestRemovalBatch. |
| CachePayloadRemovalBatch | Tracks expiration of payload data, including system reference date, total expired records, and first and most recent reference dates. |
| CachePayloadRemovalBatchEntry | Contains details of payload GUIDs removed in a batch. |
| CachePayloadRemovalBatchResponseTime | Details task performance and response times for CachePayloadRemovalBatch. |
| LocalCacheInstance | Tracks counts and memory pressure of the local cache. |
| LocalCacheInstanceKey | Tracks performance metrics and counters for a corresponding Redis key, including requests, misses, removals, distributed subscriptions, and response times. Highlights local cache pressure and cache misses, indicating load on Redis. |
| LocalCacheInstanceLru | Tracks LRU cache performance metrics, including bytes and counters for additions, removals, updates, and evictions. |
| EntityAnalysisAsynchronousQueueBalance | Tracks system-level background concurrency tasks, such as asynchronous model invocations, pending callbacks, case creation backlogs, pending notifications, and tags pending storage. |
| EntityAnalysisModelAsynchronousQueueBalance | Tracks model-level background concurrency tasks, such as records pending storage to archive and activation watcher dispatch. |
| EntityAnalysisModelProcessingCounter | Tracks model invocation events and limit breaches, including overall invocations, gateway flow counts, response elevations, total response elevations, pressure on response elevation limits, and activation watcher activity. Also carries the min/max whole-invocation response time for the interval (MinResponseTimeMicroseconds/MaxResponseTimeMicroseconds), alongside the existing total. |
| EntityAnalysisModelStagePerformanceCounter | Per-Model, per-minute rollup of the invoke pipeline’s own stages (Parse, Gateway, Activation, and so on) – total/min/max microseconds and invocation count per stage. See HTTP API Performance Trace. |
| EntityAnalysisModelResponseTimePipelineCounter | The always-on equivalent for the main serial checkpoint pipeline (Parse, Gateway, WriteResponse, etc), additionally carrying total/min/max allocated bytes per checkpoint. See HTTP API Performance Trace. |
| EntityAnalysisModelTaskPerformanceCounter | Per-Model rollup of the asynchronous read/write tasks queued during invocation (e.g. SanctionsAsync, CachePayloadUpsertAsync), with time and allocated bytes – the most direct way to attribute cloud compute cost to a specific task. See HTTP API Performance Trace. |
| ArchiverStagePerformanceCounter | The same per-minute stage rollup as EntityAnalysisModelStagePerformanceCounter, applied to the Archiver’s own background stages (BuildArchiveJson, CaseCreationDispatch, RdbmsArchiveWrite, BulkCopyArchiveBuffer) rather than the invoke pipeline. See Background Processing Performance. |
| ArchiverWarning | One row per Archiver stage invocation that took longer than the configured warn threshold, carrying the Model, the specific invocation and which stage was slow. See Background Processing Performance. |
| CaseCreationStagePerformanceCounter | The equivalent stage rollup for case creation’s own stages (ExistingCasePriorityLookup, WorkflowStatusLookupAndPersist, Notification, HttpEndpoint) – a single global queue shared by every Model, not scoped to one. See Background Processing Performance. |
| CaseCreationWarning | One row per case creation stage invocation that took longer than its warn threshold, carrying the case workflow/key and, for a slow Notification or HttpEndpoint stage, the actual destination or URL involved. See Background Processing Performance. |
| ModelInvokeWarning | The database-backed counterpart of the invoke pipeline’s trace-log warn threshold – one row per trace point whose gap since the previous one breached that Model’s Logs: Warn Threshold Milliseconds. See Background Processing Performance. |
| CaptureQueueHealth | Per-minute QueueDepth/DroppedCount health check across the six bounded in-memory capture queues platform-wide (ModelInvokeWarning, CaseCreationWarning, ArchiverWarning, RedisSentinelEvent, RedisConnectionEvent, OpenTelemetryMetric) – a QueueDepth that never falls, or any non-zero DroppedCount, means real data is being delayed or silently discarded. See Background Processing Performance. |
| RedisCallCounter | Per-minute rollup of every Jube.Cache repository method’s Redis calls (e.g. CachePayloadRepository.InsertAsync), by Call label – answers exactly where Redis load is coming from by area of the system. See Infrastructure Health Metrics. |
| OtlpDispatchCounter | Per-minute rollup of this instance’s own OTLP export attempts to its configured OpenTelemetry backend, by Signal (Traces/Metrics/Logs) – Count/SuccessCount/FailureCount/DroppedCount, so a dead or overwhelmed backend is observable rather than silent. See OTLP Dispatch Counter. |
| PostgresStatementStatistics | Not a per-minute rollup like the rows above – a live, on-demand view over Postgres’ own pg_stat_statements extension: per-query-shape aggregate calls/time/rows/cache-hit/temp-spill/WAL statistics accumulated since the extension was created or last reset. Requires shared_preload_libraries = 'pg_stat_statements' server-side (see Jube.Cluster/PgStatStatementsRollout.md). See Infrastructure Health Metrics. |
| HttpProcessingCounter | Tracks overall HTTP counters for API requests. |
The tables can be queried simply via SQL, and filtered as required for monitoring. For example, to monitor for Archive events backing up:
select * from "EntityAnalysisModelAsynchronousQueueBalance"
         where "Archive" > 1000
         order by 1 desc
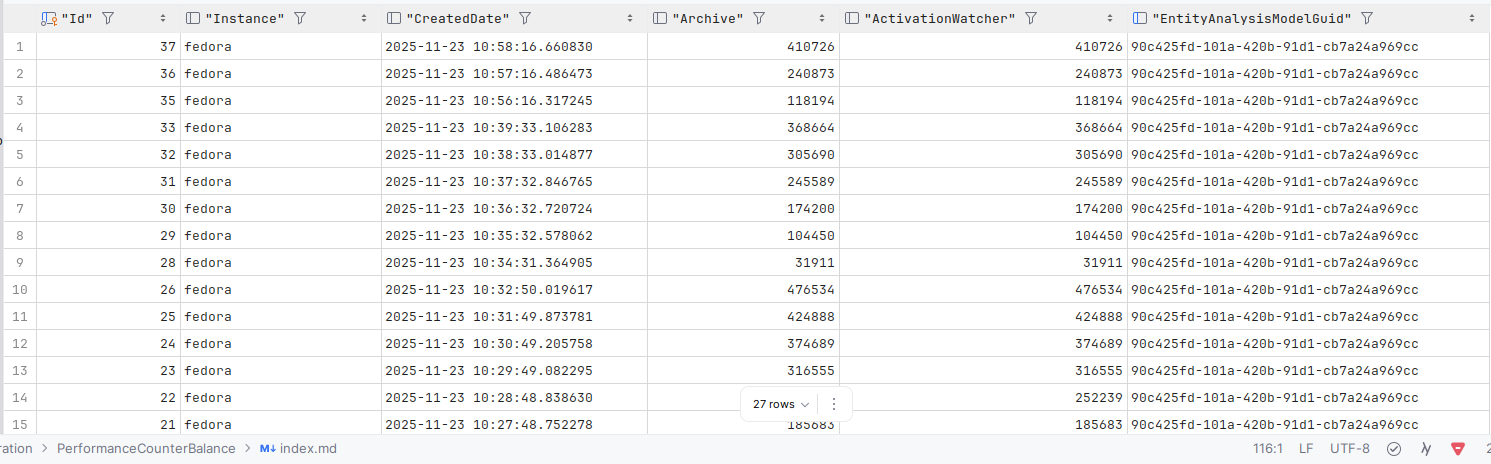
These four tables are also browsable without a database connection: GET /api/HttpProcessingCounter, GET /api/EntityAnalysisAsynchronousQueueBalance, GET /api/EntityAnalysisModelAsynchronousQueueBalance and GET /api/EntityAnalysisModelProcessingCounter, or via their respective pages under Administration » Performance in the UI. Each accepts from/to (a UTC date/time range against CreatedDate, inclusive, each defaulting independently to the last hour when omitted), take (most recent first, clamped to 100000), samplePercentage (0-100, clamped – not exposed in any toolbar; intended for an agent building an unbiased random baseline sample of activity rather than for browsing) and sortField/sortDirection (any column the grid displays; sortDirection case-insensitive, asc for ascending and anything else including omitted for descending; an unrecognised or omitted sortField falls back to most-recent-first), pushed down to the database rather than filtered after the fetch. The two Model-scoped tables (EntityAnalysisModelAsynchronousQueueBalance and EntityAnalysisModelProcessingCounter) additionally accept search, a case-insensitive substring match against the Model’s name. Each viewer page in the UI exposes the equivalent filters from a toolbar above its grid, pre-populated with that same last-hour range, and sorts server-side on column-header click.
Each response is an envelope, not a bare array: { rows, total, statistics }. rows is the page actually returned (respecting take); total is the true count of every row matching the filter, regardless of take; statistics is a summary-statistics block – Min/Max/Mean/Median/StandardDeviation and a 10-bucket histogram, computed via Accord.NET over the full filtered set (capped at 100000, independent of take) – keyed by the camelCase name of every continuous/measured numeric column (a reset counter or rolling balance, whatever its CLR type) on that DTO: model/asynchronousModel/tag/error/sanction/exhaustive/all for HttpProcessingCounter; caseCreation/tagging/notification/asynchronousEntityInvoke for EntityAnalysisAsynchronousQueueBalance; archive/activationWatcher for EntityAnalysisModelAsynchronousQueueBalance; and modelInvoke/gatewayMatch/responseElevation/responseElevationSum/activationWatcher/responseElevationLimit/ modelTotalResponseTime/minResponseTimeMicroseconds/maxResponseTimeMicroseconds/archiveWalPendingCount for EntityAnalysisModelProcessingCounter. Categorical numeric columns (ids, codes) are never included even though numeric.
The finer-grained per-stage breakdown behind EntityAnalysisModelProcessingCounter’s totals – and the equivalent rollups for the Archiver and case creation background pipelines – are documented separately: see HTTP API Performance Trace and Background Processing Performance.
Every table above beyond the original four Rolling/Reset counters follows the same envelope ({ rows, total, statistics }), take/from/to/samplePercentage/sortField/sortDirection query convention, and the same landlord-only restriction – each just adds its own extra filter on top (an exact-match stageId, directionId/taskTypeId, signalId or queueId, or a free-text search). In brief, grouped by what each is actually for:
- Model pipeline breakdown (
EntityAnalysisModelStagePerformanceCounter,EntityAnalysisModelResponseTimePipelineCounter,EntityAnalysisModelTaskPerformanceCounter) – turns the single invoke-pipeline totals already inEntityAnalysisModelProcessingCounterinto a per-stage and per-task breakdown, so a slow Model can be traced to the specific stage or task responsible. Full detail: HTTP API Performance Trace. - Background pipeline breakdown and warnings (
ArchiverStagePerformanceCounter,ArchiverWarning,CaseCreationStagePerformanceCounter,CaseCreationWarning,ModelInvokeWarning,CaptureQueueHealth) – the same idea applied to the two pipelines that run entirely off the invoke thread (persisting the Archive payload, then case creation), plus a database-backed record of every warn-threshold breach across all three pipelines and a health check on the bounded in-memory queues that capture them. Full detail: Background Processing Performance. - Redis and OTLP export (
RedisCallCounter,OtlpDispatchCounter) – the same per-minute rollup shape applied to outbound Redis calls and to this instance’s own OTLP export attempts, so a Redis slowdown or a dead OpenTelemetry backend is observable from a table rather than only from logs. Full detail: Infrastructure Health Metrics and OTLP Dispatch Counter. - Postgres query-shape statistics (
PostgresStatementStatistics) – the one table above that is not a per-minute rollup: a live view overpg_stat_statements, refreshed on demand rather than written every 60 seconds, answering “which query shape is worst overall, across all history” rather than “what happened this last minute”. Full detail: Infrastructure Health Metrics. - OpenTelemetry Log Counter – not an observability table itself, but the configuration behind a related feature: the
OpenTelemetryLogCounteradministration page defines Name/Regex rules that are checked against every unstructured log line reaching this instance (ApplicationLogEntry,PostgresLogEntry,ContainerLogEntry,RedisSlowOperation,EtcdClusterEvent,PatroniClusterEvent), incrementing a named OpenTelemetry counter on a match. Full detail: OpenTelemetry Log Counter.